Sentiments Analysis of Financial News for Amazon Stock Price
Sentiments analysis on news has become one of the most robust ways of generating a buy/sell signals for stocks in all major developed and major emerging markets. The idea is simple, a cumulative sentiments score of the news articles mentioning a companies name, brand, stock ticker etc. will serve as a great indicator for next days’ closing stock price.
This only works with stocks which have high trading volumes and an active news coverage across major outlets. Generally speaking, constituent stocks of major market indices such as NASDAQ, Dow Jones, or S&P 500 will all satisfy this criteria.
In this article we will discuss the steps necessary for building such a sentiments analysis pipeline for amazon.com stock.
You will have to select which portions of the page you want to extract. Typically, people want to extract author names, dates, titles, and full text of the news article.
Plotting Amazon Stock Price
Before we get into actually getting sentiments data, let us first get stock market data for Amazon stock price (AMZN). I like to use Alphavantage’s API to get stock market data; its free to use but you will have to generate an API key.
import requests
import json

test_url = 'https://www.alphavantage.co/query?function=TIME_SERIES_DAILY_ADJUSTED&symbol=AMZN&outputsize=full&apikey=' + API_KEY + '&datatype=csv'

r = requests.get(url = test_url)
print("Status Code: ", r.status_code)
print("*"*20)
print(r.headers)
html_response = r.text
with open("amazon_stock.csv", "w") as outfile:
    outfile.write(html_response)

    from dateutil import parser
datetime_obj = lambda x: parser.parse(x)

df2 = pd.read_csv("amazon_stock.csv", parse_dates=['timestamp'], date_parser=datetime_obj)

#df2 = df2[(df2["timestamp"] >= start_date) & (df2["timestamp"] <= end_date)]

df2.head(1)
# Output

	timestamp 	open 	high 	low 	close 	adjusted_close 	volume 	dividend_amount 	split_coefficient
0 	2020-09-28 	3148.85 	3175.04 	3117.1684 	3174.05 	3174.05 	4224165 	0.0 	1.0
Next, we will plot this so that we can visually see the price movements. As you might already know, the stock has had a strong rally due to covid-19 pandemic.
import matplotlib.pyplot as plt
import seaborn as sns

top = plt.subplot2grid((4,4), (0, 0), rowspan=3, colspan=4)
top.plot(df2['timestamp'], df2['close'], label = 'Closing price')
plt.title('Amazon Close Price')
plt.legend(loc=2)
bottom = plt.subplot2grid((4,4), (3,0), rowspan=1, colspan=4)
bottom.bar(df2["timestamp"], df2["volume"])
plt.title('Amazon Daily Trading Volume')
plt.gcf().set_size_inches(12,8)
plt.subplots_adjust(hspace=0.75)

Amazon stock price in past twenty years
Scraping News Articles
Getting news articles in bulk in a structured format will take lot of data wrangling if you intend to scrape more than one news source. A good place to start will be looking over our blog post on scraping CNN news articles and using it as a template to scrape title, content, date, author etc. from other news websites.
Once you have the raw articles, you will have to load them into a full text search database like Elasticsearch, Amazon Cloudsearch, Apache Solr etc. and than search for the stock name or stock ticker of your choice to locate relevant articles.
We will instead use a free public API that lets us query for news articles from all major news sources within past 7 days. Our latest and historical news API returns a maximum of 100 news articles per API call and you can paginate through the results if needed. The basic plan is free forever and premium plans start only at $10/month instead of hundreds of dollars a month for our competitors.
import requests
import json
url = "https://latest-news1.p.rapidapi.com/"
payload = json.dumps({"domains": "","topic":"business","q":        "amazon","qInTitle": "", "content":"", "page":"1", "author_only":""})
headers = {
    'content-type': "application/json",
    'x-rapidapi-key': "YOUR_RAPID_API_KEY",
    'x-rapidapi-host': "latest-news1.p.rapidapi.com"
    }
response = requests.request("POST", url, data=payload, headers=headers)
    # after paginating through results
    print("Total results found: ", response_dict["totalResults"])
    clean_response_list = clean_response_list + response_dict["Article"]
len(clean_response_list)
#Output
fetching page  1
Total results found:  1263
Let’s load it up in pandas dataframe and use it later for sentiments analysis.
import numpy as np
import pandas as pd

df = pd.DataFrame(clean_response_list)
df.head()
#Output
author 	content 	description 	publishedAt 	source_name 	source_url 	title 	url 	urlToImage
0 	[] 	Market Overview Tickers Articles Keywords Che... 	GameStop Corp (NYSE: GME) could be extending i... 	2020-09-22 	Benzinga 	benzinga.com 	Gamestop Corporation (NYSE:GME), Amazon.com, I... 	https://www.benzinga.com/news/20/09/17595730/c... 	https://cdn.benzinga.com/files/imagecache/og_i...
1 	["www.ETAuto.com"] 	Uber investors are pressuring CEO to revamp t... 	When Khosrowshahi assumed Uber’s helm from ous... 	2020-09-22 	ETAuto.com 	indiatimes.com 	Uber business strategy: Uber investors are pre... 	https://auto.economictimes.indiatimes.com/news... 	https://etimg.etb2bimg.com/thumb/msid-78248237...
2 	[] 	Xiaomi recently launched the entry-level Redm... 	Xiaomi's new entry-level smartphone offers sol... 	2020-09-22 	News18 	news18.com 	Redmi 9A Goes on Sale Today on Amazon and Mi.c... 	https://www.news18.com/news/tech/redmi-9a-goes... 	https://images.news18.com/ibnlive/uploads/2020...
3 	[] 	Bolsonaro faces growing pressure to green Bra... 	Bolsonaro faces growing pressure to green Braz... 	2020-09-22 	France 24 	france24.com 	Bolsonaro faces growing pressure to green Braz... 	https://www.france24.com/en/20200922-bolsonaro... 	https://s.france24.com/media/display/aac6e8c6-...
4 	[] 	Market Overview Tickers Articles Keywords Che... 	GameStop Corp (NYSE: GME) could be extending i... 	2020-09-22 	Benzinga 	benzinga.com 	Gamestop Corporation (NYSE:GME), Amazon.com, I... 	https://www.benzinga.com/news/20/09/17595730/c... 	https://cdn.benzinga.com/files/imagecache/og_i...
Sentiment Analysis using NLTK’s Vader
There are numerous algorithms out there for calculating sentiments on text; with the best ones typically being the ones trained on neural networks such as BERT on large datasets. You can use it for an accurate analysis, however, for a rule of thumb study like this, we can simply use vader sentiments algorithm packaged with NLTK library. The sentiments score vary from -1 to 1 with compound column giving the sentiments score.
import nltk
nltk.download('vader_lexicon')
from nltk.sentiment.vader import SentimentIntensityAnalyzer
vader = SentimentIntensityAnalyzer()

scores = df['title'].apply(vader.polarity_scores).tolist()
scores[:5]
#Output
[{'compound': 0.1779, 'neg': 0.0, 'neu': 0.892, 'pos': 0.108},
 {'compound': -0.3947, 'neg': 0.143, 'neu': 0.857, 'pos': 0.0},
 {'compound': 0.1779, 'neg': 0.0, 'neu': 0.884, 'pos': 0.116},
 {'compound': -0.128, 'neg': 0.185, 'neu': 0.672, 'pos': 0.143},
 {'compound': 0.1779, 'neg': 0.0, 'neu': 0.892, 'pos': 0.108}]
Let us join this to our initially created dataframe.
scores_df = pd.DataFrame(scores)
# join it with main dataframe
df = df.join(scores_df, rsuffix='_right')

# Convert the date column from string to datetime
df['date'] = pd.to_datetime(df.publishedAt).dt.date

# Group by date and ticker columns from scored_news and calculate the mean
mean_scores = df.groupby(['date']).mean()
mean_scores
# Output

	compound 	neg 	neu 	pos
date
2020-09-22 	0.099078 	0.079065 	0.787065 	0.133871
2020-09-23 	0.084607 	0.064409 	0.812341 	0.123260
2020-09-24 	0.150295 	0.045265 	0.822676 	0.132071
2020-09-25 	0.061525 	0.063262 	0.838885 	0.097852
2020-09-26 	0.210888 	0.044955 	0.790333 	0.164773
2020-09-27 	0.257901 	0.043290 	0.751855 	0.204855
2020-09-28 	0.292509 	0.020722 	0.783089 	0.196189
All we need to do now is plot this sentiments score as a bar chart and compare it with stock prices.
import matplotlib.pyplot as plt

plt.rcParams['figure.figsize'] = [10, 6]

mean_scores = mean_scores.unstack()

# Get the cross-section of compound in the 'columns' axis
mean_scores = mean_scores.xs('compound').transpose()

# Plot a bar chart with pandas
mean_scores.plot(kind = 'bar')
plt.grid()

# Plotting a subset of amazon stock price for 7 days
# code block 1.2 (Cont.)

# Plotting stock and volume

top = plt.subplot2grid((4,4), (0, 0), rowspan=3, colspan=4)
top.plot(df2['timestamp'], df2['close'], label = 'Closing price')
plt.title('Amazon Close Price')
plt.legend(loc=2)
bottom = plt.subplot2grid((4,4), (3,0), rowspan=1, colspan=4)
bottom.bar(df2["timestamp"], df2["volume"])
plt.title('Amazon Daily Trading Volume')
plt.gcf().set_size_inches(12,8)
plt.subplots_adjust(hspace=0.75)
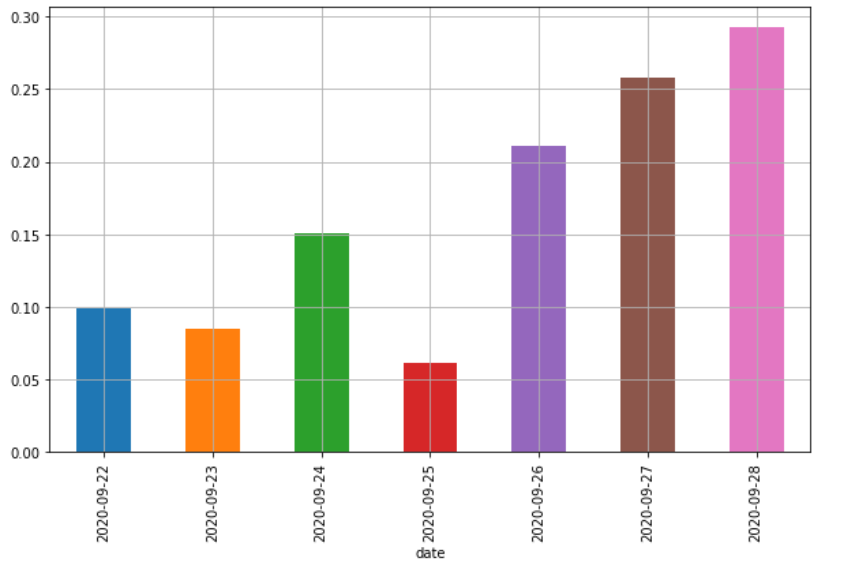
Amazon news sentiments plot
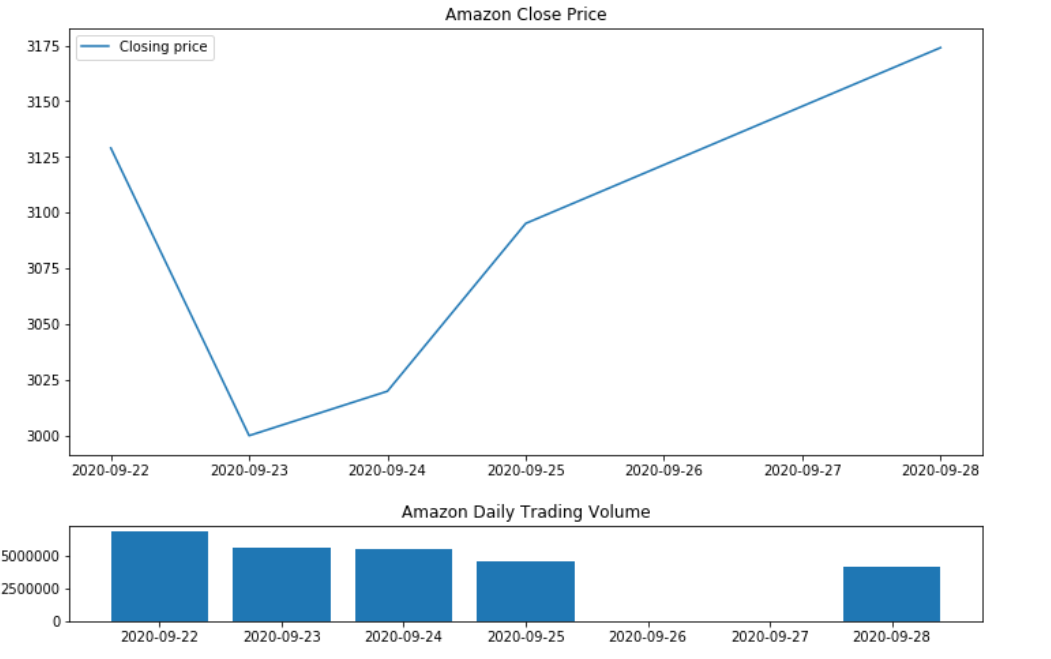
Amazon stock price in for seven days
We can see quite immediately that positive news sentiments flow after 23 September led the overall price increase. There are still lot of limitations with this kind of simplistic analysis but it does show that sentiments analysis of news works pretty good.
The major limitations include:
When combining different news sources, we have to perform weighted averages on sentiments score by taking into account the overall domain authority and total number of audience of each source. For example, a negative article in Wall street Journal should be taken at a higher sentiments value than a negative article in a seeking alpha blog post.
We should always consider stock price movement of a basket of securities in a particular sector to account for any sectoral or macroeconomic changes especially in these uncertain times of pandemic induced market volatilities.